You have a candidate geometry, but will it actually keep the junction temperature below its limit without exceeding the pump’s pressure budget? Good cold plate design requires precise thermal-hydraulic math. This guide provides the exact formulas for calculating cold plate thermal resistance and pressure drop, a complete reproducible screening example (500 W, 20 channels), and the engineering rules for determining when hand calculations are sufficient and when you must switch to CFD.
Key Takeaways
- Start with the heat load, heat-flux map, temperature limits, coolant inlet conditions, flow range, and pressure budget. Without these constraints, geometry optimization has no target.
- Pressure-drop scaling depends on flow regime: in fully developed laminar flow, friction pressure drop scales roughly with velocity; in a fixed-geometry turbulent passage, it scales roughly with velocity squared.
- Thermal-resistance uncertainty can be large: expect ±15–20% at low heat flux and roughly ±10% at high heat flux, unless the TIM and flow condition are tightly controlled.
- If coolant-side convection is already a small share of total resistance, further channel refinement buys little junction-temperature improvement.
- Hand calculations screen candidates; CFD is for three-dimensional spreading, manifold maldistribution, and hotspots. Use our 10% / 15% error margin rules to know when to switch.
1. Thermal-Hydraulic Design Calculations: Heat Transfer vs. Pressure Drop and Pump Power
1.1 Flow Rate, Velocity, and Pressure Drop
Mean coolant velocity is calculated from volumetric flow rate and open flow area:
v = V̇ / Ac,total
Here, V̇ is volumetric flow rate and Ac,total is the combined open cross-sectional area carrying that flow.
Mass flow rate is:
ṁ = ρV̇
The bulk coolant temperature rise follows from an energy balance:
Q = ṁcp(Tout − Tin)
This estimates the bulk coolant temperature rise. It does not predict the maximum component or hotspot temperature; that requires the full thermal-resistance chain.
For a straight passage, the Darcy-Weisbach equation estimates frictional pressure loss, with local losses added separately:
Δp = f(L / Dh)(ρv² / 2) + ΣK(ρv² / 2)
Here, f is the Darcy friction factor, L is passage length, and ΣK represents bends, contractions, expansions, ports, and manifold losses.
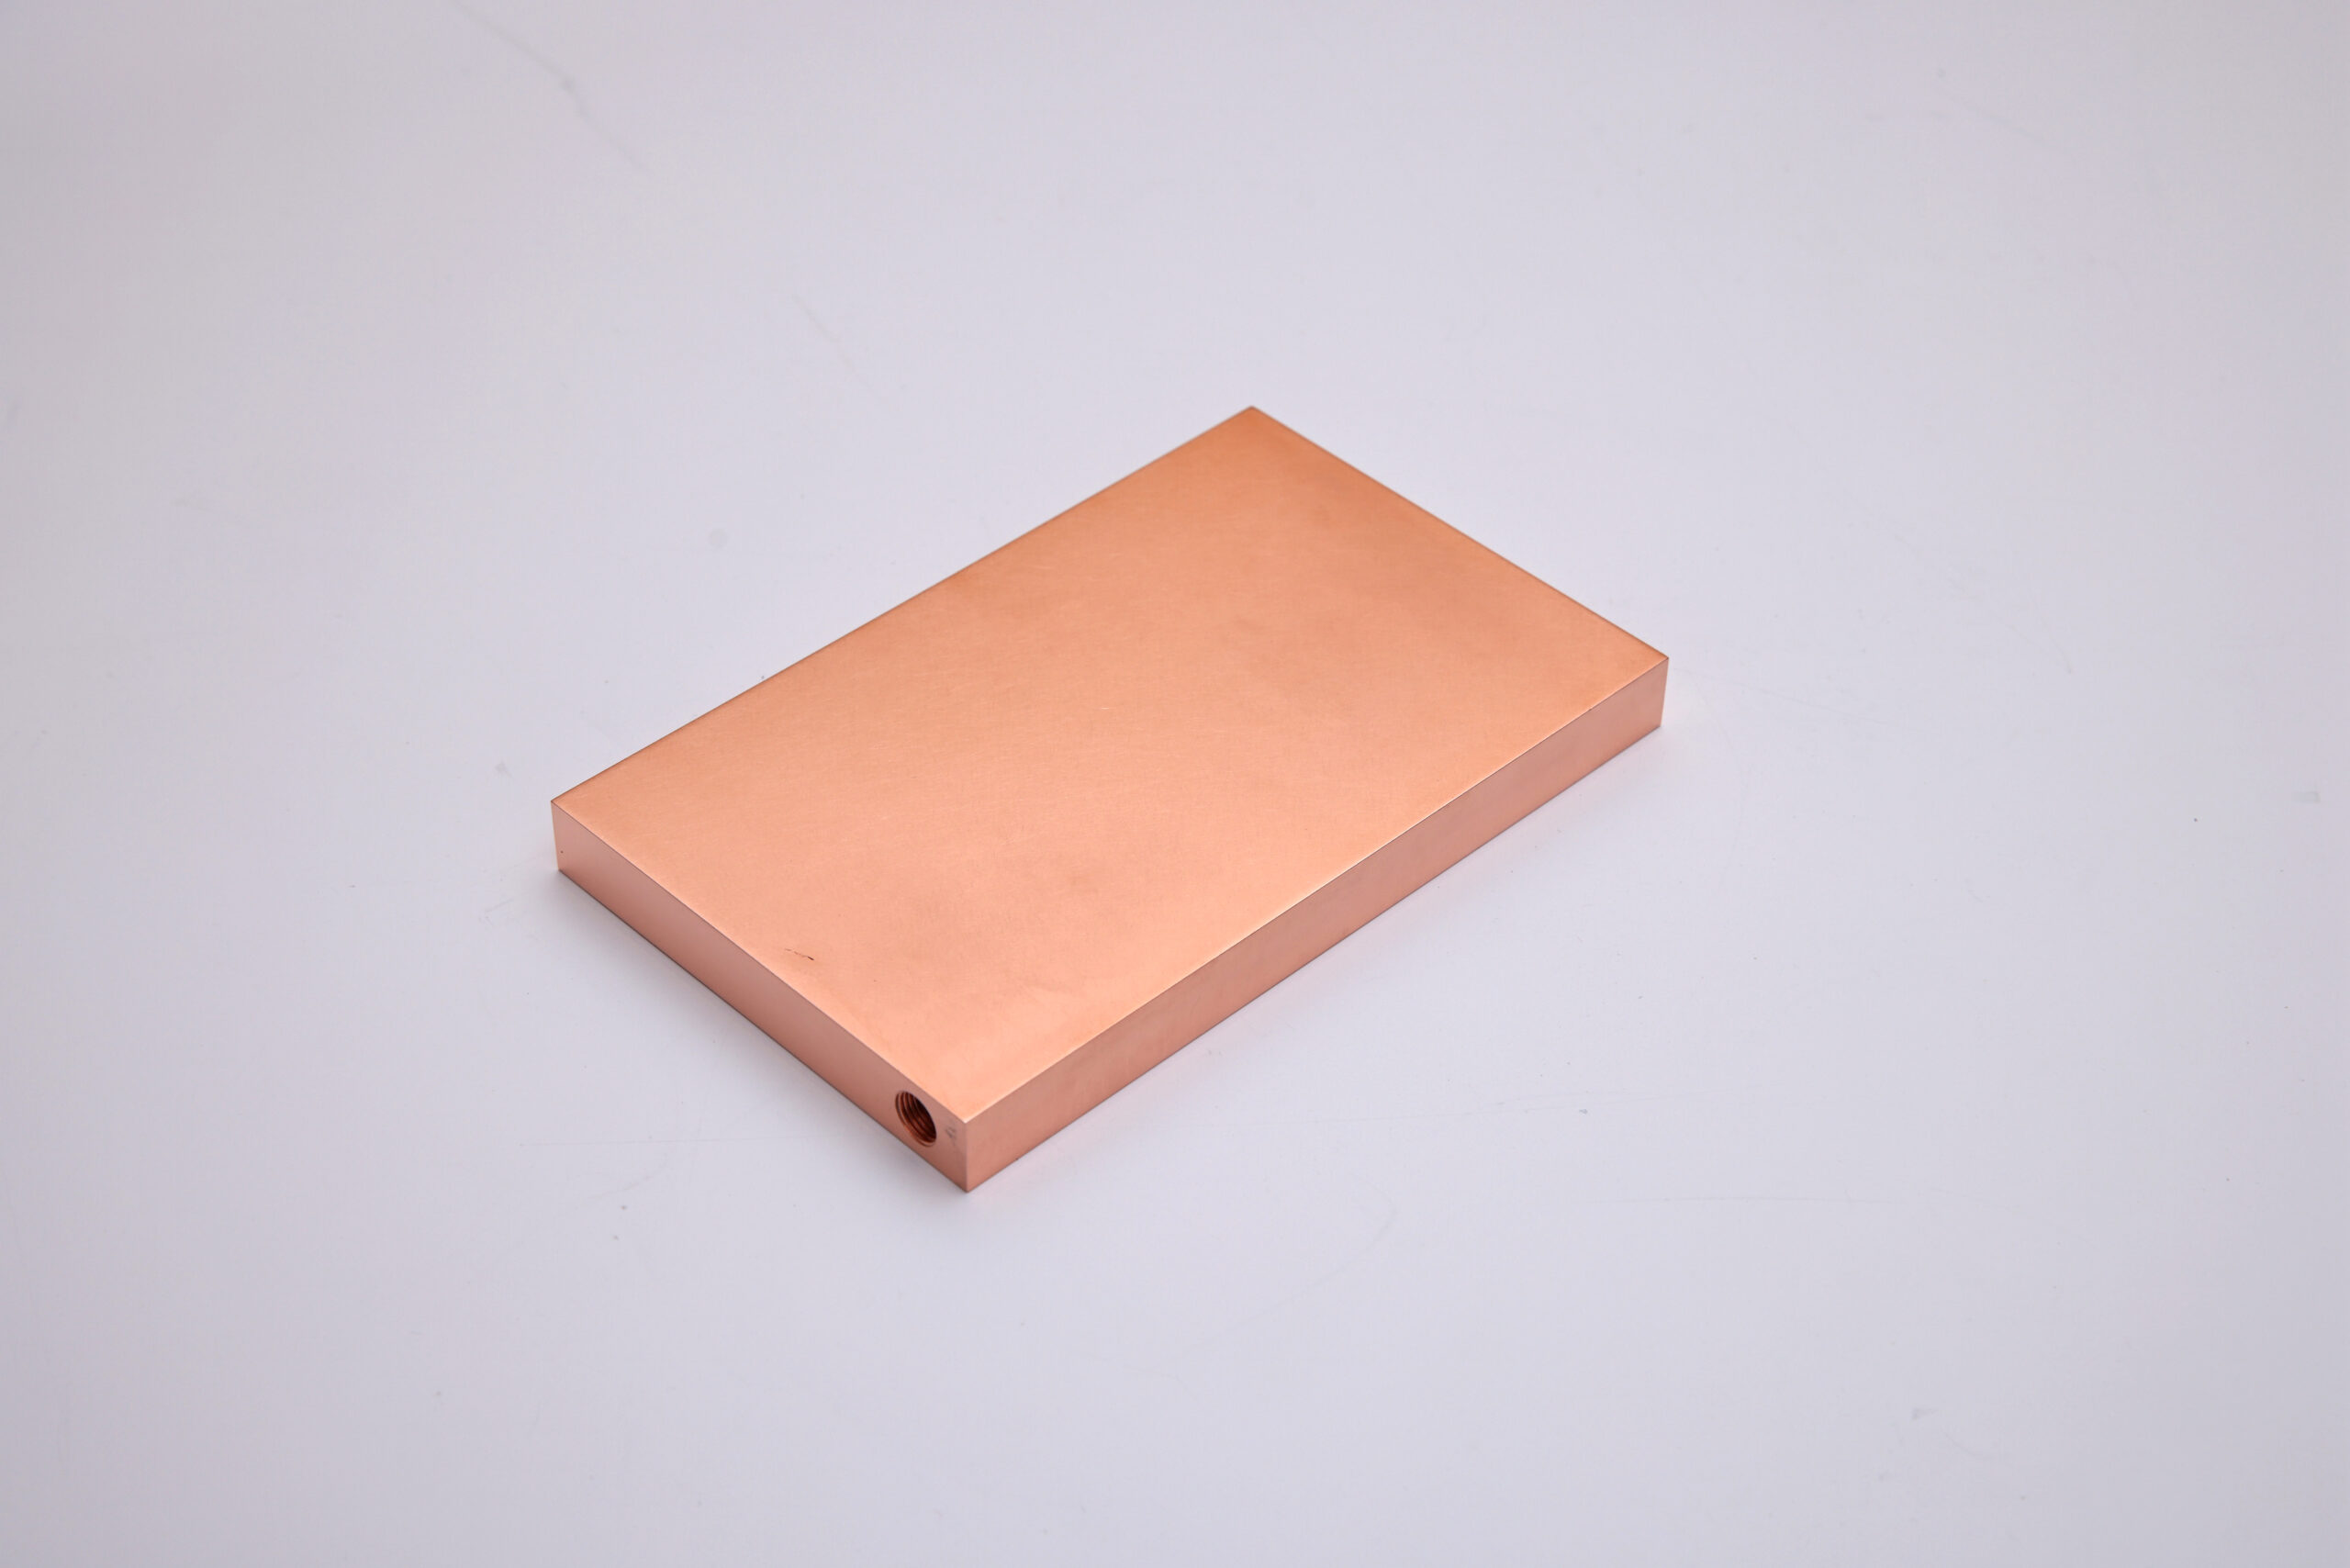
Dh) and friction factor (f) used in the Darcy-Weisbach calculation above.1.1.1 A Reproducible Screening Example
Consider a 500 W cold plate with 20 parallel rectangular channels, each 4 mm wide, 2 mm high, and 100 mm long. The coolant is a 50/50 water-glycol mixture at 40 °C, with approximate properties ρ = 1050 kg/m³, μ = 0.0025 Pa·s, cp = 3400 J/(kg·K), and Pr ≈ 21. Total flow is 2 L/min (3.33 × 10⁻⁵ m³/s).
- Flow per channel: 3.33 × 10⁻⁵ / 20 = 1.67 × 10⁻⁶ m³/s.
- Channel area: 4 × 10⁻³ × 2 × 10⁻³ = 8 × 10⁻⁶ m².
- Mean velocity: 1.67 × 10⁻⁶ / 8 × 10⁻⁶ ≈ 0.21 m/s.
- Hydraulic diameter:
Dh = 4Ac / Pw= 4 × 8 × 10⁻⁶ / (2 × (4 + 2) × 10⁻³) ≈ 2.67 × 10⁻³ m. - Reynolds number:
Re = ρvDh / μ≈ 1050 × 0.21 × 2.67 × 10⁻³ / 0.0025 ≈ 234. The flow is laminar. - For fully developed laminar flow in a circular pipe,
f = 64 / Re≈ 0.27. Rectangular channels require a geometry-dependent correction; this value is a screening approximation, not a final design number. - Friction pressure drop per channel: 0.27 × (0.1 / 2.67 × 10⁻³) × (1050 × 0.21² / 2) ≈ 230 Pa. Adding inlet, outlet, and manifold losses typically raises the plate-level value to roughly 300–600 Pa, depending on port design.
- Hydraulic pump power:
P = Δp × V̇≈ 400 × 3.33 × 10⁻⁵ ≈ 0.013 W. This is small because the flow is laminar and the channels are short; it is not a general result for production cold plates. - Bulk coolant temperature rise:
ΔT = Q / (ṁcp), withṁ= 1050 × 3.33 × 10⁻⁵ ≈ 0.035 kg/s, gives 500 / (0.035 × 3400) ≈ 4.2 K.
This example shows why pressure-drop scaling must be stated with its flow regime. In fully developed laminar flow, f ∝ 1/Re, so Δp scales approximately with velocity, and quadrupling flow produces roughly four times the friction pressure drop in the same geometry. In a fixed-geometry turbulent passage where f is approximately constant, Δp scales with velocity squared, and quadrupling flow produces roughly sixteen times the friction pressure drop. Real cold plates deviate because of transition, manifold losses, port losses, and pump-system interaction. Calculate or measure the actual system curve; do not quote a single multiplier out of context.
1.2 Coupling Between Thermal Resistance and Pressure Drop
Narrower channels and denser fins may improve heat transfer by increasing area or disturbing the thermal boundary layer. They also tend to increase hydraulic resistance.
Higher flow can reduce coolant temperature rise and may increase the convective heat-transfer coefficient, but it also increases pump demand. In some systems, high velocities can raise erosion, vibration, or noise risks.
Compare candidate designs using maximum component temperature, temperature uniformity, thermal resistance, pressure drop, flow rate, pump power, mass, and manufacturability. Do not optimize heat-transfer coefficient alone.
Practical rule: if the coolant-side convective resistance is less than roughly 20–30% of the total thermal resistance, further channel refinement usually produces little junction-temperature improvement while still increasing pressure drop. Measure or estimate the resistance split before changing geometry. This is an engineering heuristic, not a standard.
1.3 Pump Power, System Energy, PUE, and EV Efficiency
The hydraulic power required to move coolant is:
Phydraulic = Δp × V̇
Estimated electrical pump input is:
Pelectrical ≈ (Δp × V̇) / ηpump
Here, ηpump is the overall efficiency from electrical input to hydraulic output, based on the selected efficiency definition.
Real systems also have control, heat-exchanger, and distribution losses. In data centers, cooling energy affects power usage effectiveness (PUE), which reflects the entire facility rather than the cold plate alone. In EVs, pumps and heat exchangers consume vehicle energy.
The goal is sufficient thermal performance at an acceptable total energy cost, not simply maximum flow.
1.4 Quantifying Design Constraints
Define measurable limits before optimizing the geometry:
- Heat load: Total dissipated power and spatial heat-flux distribution.
- Temperature limits: Maximum case, junction, or interface temperature and required uniformity.
- Coolant conditions: Fluid type, inlet temperature range, concentration, and relevant properties.
- Flow range: Nominal, minimum, and maximum flow rates.
- Pressure budget: Maximum allowable pressure drop across the plate, separate from the total loop limit.
- Mechanical constraints: Envelope, mass, mounting loads, pressure rating, port locations, and seals.
- Reliability requirements: Leakage limits, operating life, corrosion exposure, and environmental conditions.
Keep the cold plate pressure-drop allowance distinct from the budget for hoses, manifolds, filters, quick disconnects, valves, and heat exchangers.
1.5 Simplified Calculation Workflow and When to Use CFD
- Establish the heat load, heat-flux map, temperature limits, and coolant inlet conditions.
- Estimate the required mass flow from the allowable bulk coolant temperature rise using
Q = ṁcpΔT. - Select a preliminary material, base thickness, channel layout, and feasible channel dimensions.
- Estimate conduction resistance, convective resistance, pressure drop, and pump power using appropriate correlations.
- Check thermal and hydraulic limits across the full operating range.
- Use CFD when three-dimensional spreading, manifold maldistribution, localized hotspots, complex fin geometry, or conjugate heat transfer makes simplified correlations unreliable.
- Validate important predictions against a physical prototype and update the model using measured data.
Hand calculations are useful for screening and sanity checks. CFD is most valuable when it answers a specific design question that simplified models cannot resolve reliably.
2. When to Stop Calculating and When to Switch to CFD
2.1 Error Margins by Geometry
Hand calculations are sufficient for screening when three conditions hold: the heat input is approximately uniform, the channel flow is evenly distributed by the manifold, and the geometry can be represented by straight or simple parallel passages. Under those conditions, straight-channel pressure-drop estimates can remain within roughly 10% of a validated model. For serpentine channels, the same 10% margin holds when the Dean number is at or below about 40; above that, bend losses and secondary flows degrade the correlation. Manifold-fed configurations are harder: a simple model does not meet the 10% criterion, and to stay within roughly 15% the inlet-to-channel area ratio should be at most about 0.13, the branch velocity ratio should be close to unity, and the Reynolds number should be low. Outside those conditions, hand calculations are for ranking candidates, not for design release. The practical rule is: ~10% for straight or well-behaved serpentine channels, ~15% for balanced manifolds within the stated ratios, and no reliable single-number error for strongly maldistributed or highly asymmetric manifolds.
Thermal-resistance uncertainty is a separate, and often larger, error source. A controlled experimental study of single-phase cold plates reported that thermal-resistance uncertainty decreases from 13% at 7.3 W/cm² to 1.6% at 70 W/cm². The dominant contributors are not the convection correlation itself; they are the thermal boundary condition supplied by the test vehicle, the interpretation of the solid surface temperature, and the contact between the cold plate and the heater. For hand calculations, this means: if the heat flux is low (below roughly 10 W/cm²) and the TIM/contact stack is not tightly controlled, a thermal-resistance estimate should be treated as ±15–20% at best. At high heat flux (above roughly 50 W/cm²), the experimental uncertainty compresses, but the model-to-test deviation may still be dominated by TIM bond-line thickness and flow distribution rather than by the Nusselt-number correlation. Do not claim better than ~10% on thermal resistance unless you have a validated test coupon with the same TIM, mounting pressure, and flow condition.
2.2 When to Switch to CFD
Switch to CFD when any of the following is true:
- The heat-flux map has a hotspot whose footprint is smaller than roughly three channel widths.
- The manifold feeds more than roughly six parallel branches and the branch lengths differ by more than about 20%.
- The design uses serpentine, branched, or pin-fin regions where the flow direction changes repeatedly.
- The pressure budget is within roughly 15% of the pump’s available pressure at the target flow.
- The allowable component temperature is within roughly 10 °C of the calculated maximum.
These are screening triggers, not absolute rules. The point is to avoid running CFD on a design that hand calculations can already reject, and to avoid releasing a design that hand calculations cannot resolve.
2.3 Validation Checklist: If Your Hand Calculation and Test Disagree
When measured pressure drop or temperature deviates from the hand calculation by more than the applicable margin above, work through the following before changing the channel geometry:
- Check the reference points. Pressure-drop taps must be at the same locations used in the model (inlet to outlet, including or excluding fittings). A difference in tap location can account for a large fraction of the deviation.
- Check the as-built dimensions. Channel width, height, and port diameters after machining or brazing may differ from the CAD nominal. Measure a sample, not the drawing.
- Check the flow distribution. If the plate has parallel branches, measure branch flow or use a flow-network model. A starved branch will show up as a local hotspot even when total flow is correct.
- Check the TIM. Bond-line thickness, contact pressure, and coverage are common sources of a 10–30% thermal-resistance error. A thicker-than-assumed bond line can dominate the deviation.
- Check the heat input. The actual power map or hotspot distribution may differ from the model input. Verify with a calibrated heat source or the device’s power telemetry.
3. Sensitivity: Which Parameter Moves the Result Most
For a typical single-phase cold plate, the calculated maximum temperature is most sensitive to, in rough order: TIM bond-line thickness and contact pressure, local flow distribution, channel width and fin thickness (through wetted area and hydraulic diameter), coolant inlet temperature, and material conductivity. Pressure drop is most sensitive to channel height and port/manifold restrictions, then to flow rate and surface roughness.
Practical implication: if the calculated temperature is marginal, check the TIM assumption and the manifold balance before narrowing the channels. If the calculated pressure drop is marginal, check the port and manifold geometry before changing the channel count. A 20% error in TIM thickness or manifold distribution can move the result more than a 20% change in channel width.
4. Frequently Asked Calculation Questions
4.1 How Do You Calculate Cold Plate Thermal Resistance?
Thermal resistance is the temperature difference divided by heat-transfer rate: Rth = ΔT / Q, in K/W. Define the measurement points clearly because component-to-coolant resistance differs from case-to-inlet-coolant resistance. Include TIM, contact, plate conduction, heat spreading, and coolant-side convection as appropriate, then validate the result under controlled test conditions. Expect ±15–20% uncertainty at low heat flux and roughly ±10% at high heat flux, unless the TIM and flow condition are tightly controlled.
4.2 How Do You Calculate Cold Plate Pressure Drop?
For a simple passage, use the Darcy-Weisbach equation and add local losses from bends, ports, contractions, expansions, and manifolds. Determine hydraulic diameter, velocity, Reynolds number, friction factor, coolant properties, and passage length. Complex parallel-channel or manifold designs may require a flow-network model or CFD, followed by measurement at the intended operating flow rates.
4.3 What Is the Thermal-Resistance Chain in a Cold Plate?
The thermal-resistance chain is Rtotal = RTIM + Rplate + Rconvection + Rother. TIM resistance depends on conductivity, thickness, and contact pressure. Plate resistance depends on material, base thickness, and heat spreading. Convective resistance depends on wetted area and heat-transfer coefficient. Reducing the wrong resistance produces little improvement; identify the largest term first.
4.4 When Does Narrowing Channels Stop Helping?
Narrower channels increase wetted area and may raise the convective coefficient, but they also increase pressure drop. If coolant-side convective resistance is already below roughly 20–30% of the total thermal resistance, further channel refinement usually produces little junction-temperature improvement. Measure or estimate the resistance split before changing geometry.
Discuss Your Cold Plate Thermal Requirements
Need to evaluate your cold plate design? Contact our team to discuss your thermal performance targets, flow conditions, and pressure drop requirements.